Table of Contents
Interface to the Mars Climate Database (MCD)
The MCD is a database of meteorological fields derived from General Circulation Model (GCM) numerical simulations of the Martian atmosphere and validated using available observational data.1)
A Python interface has been created for use with the AtRIS code as well as to give an overview of the MCD data relevant for atmospheric particle simulation.
Installation
In the following chapter, a brief instruction on how to get the MCD with the Python interface running is given (Linux only). The procedure has been tested on MCD 5.3 however, older versions of MCD 5.x or 4.x should work similarly. It is assumed that a recent distribution of Python 2, as well as recent versions of numpy and matplotlib are available on your system. Also, you will need the Fortran compiler gfortran.
Setting Up NetCDF
The use of the MCD requires the installation of NetCDF. I recommend getting an older distribution of NetCDF like version 3.6.3, as these work just fine with the MCD, are easier to install and don't require as many dependencies. After downloading the *.tar.gz file I suggest doing the following:
- Unpacking the download
gunzip netcdf-3.6.3.tar.gz
tar xvf netcdf-3.6.3.tar
- Configuring the build using the fPIC option for gfortran.
  cd netcdf-3.6.3
  export FC=gfortran
  export FFLAGS=" -O2 -fPIC"
  export F90=gfortran
  export FCFLAGS="-O2 -ffree-form -fPIC"
  export CPPFLAGS=""
  export CC=gcc
  export CFLAGS="-O2 -fPIC"
  export CXX=g++
  export CXXFLAGS="-O2 -fPIC"
- Installing NetCDF on your system. Make sure to adapt YourPath to your preferences.
  mkdir /YourPath/NETCDF/netcdf3.6.3
  ./configure --prefix=/YourPath/NETCDF/netcdf3.6.3
  make
  make install
Setting Up The MCD
Information on how to get the latest version of the MCD can be obtained on the MCD website. Please refer to the instructions given in the user manual for general use. A brief guide on how to set up the MCD is given in the following chapter. Note that the provided python Interface in the MCD distribution is not the one this article is about.
- Download the MCD files and unpack them to your
MCDlocation - Navigate to the folder
MCD/mcd - Open the file named
compileand change the variablesNCDFINCandNCDFLIBto your previously selected location of NetCDF, so thatNCDFINC/includepoints to theincludefolder andNCDFLIB/libpoints to thelibfolder of NetCDF. - Create a symbolic link to the
MCD/datadirectory by doing:
ln -s /full/path/to/MCD/data MCD_DATA
- Execute the
compilescript. This compiles the fortran subroutines - Test your installation by compiling and executing the provided test script:
gfortran test_mcd.F
./test_mcd
Setting Up The Python Interface
You can download the Interface at gitlab:
https://gitlab.physik.uni-kiel.de/roestel/MCD_Python_Interface.git
Then do the following:
- Create a symbolic link
MCD_DATAto thedatadirectory in this folder (like above). - Run
export PYTHONPATH=$PYTHONPATH:provideYourPath/MCD_Python_Interface - Open the file
compile.shin the text editor and change the variableswheremcdandNETCDFto your previously selected locations. - Run
compile.sh. Filesfmcd.log,fmcd.pyfandfmcd.soshould have been created. - You now should be able to
import MCDinterfaceand use the MCD subroutines themselves by doingfrom fmcd import call_mcd,julianin python.
Description Of The Interface
Two Classes derive from MCDinterface:
Hprofilerepresents a height profile and can be used to create atmospheric layers and save them in psf formatTprofilerepresents a time profile and can be used in order to visualize seasonal and daily changes of atmospheric parameters
MCDinterface.Hprofile(lon,lat,xdate,localtime,datekey=1,hstep=1000.0,scenario=1,dust=False)
| Constructor Input | ||
|---|---|---|
| lon | scalar | marsian longitude |
| lat | scalar | marsian latitude |
| xdate | if datekey=0 :tuple | earth date in form (day,month,year,hour,minute,second) ,year must be within [1800:2200] |
| if datekey=1 :scalar [0:360] | marsian solar longitude Ls in degrees | |
| xlocaltime | if datekey=0 : unused | unused |
| if datekey=1 :scalar [0:24] | marsian local time in hours | |
| datekey | int [0,1] | 0 for use with earth date, 1 for use with mars date |
| hstep | scalar | thicknes of each atmospheric layer in meters |
| scenario | int | simulation scenario as specified in MCD user manual |
| dust | boolean | if True, dust particles are computed in atmospheric layers.Material is same as crust material. |
| other Class Variables | ||
|---|---|---|
| Class Variable | description | default |
| crustThickness | thickness of simulated crust in meters | 100 |
| azMin | minimal azimuthal | 0 |
| azMax | maximal azimuthal | 2 pi |
| poMin | minimal polar angle | 0 |
| poMax | maximal polar angle | pi |
| tempCrust | crust temperature in K | 200 |
| densCrust | crust density in g/cm³ | 93000000 |
| presCrust | crust pressure in Pa | 5.24 |
| crustComposition | crust composition | 'O500Si400Fe100' |
| zMax | maximum height above surface to be computet in meters | 250000 |
MCDinterface.Hprofile.retrieve()
This function calls the MCD in order to retrieve the data specified by the given class parameters.
One has to call this function on an instance of Hprofile once and after making changes to the instance.
Output:
Array of shape (n,20). Each row represents an atmospheric layer,
each column represents a parameter as specified in the psf format.
MCDinterface.Hprofile.savePSF(filename)
Saves the profile to a psf format file (materials are saved GEANT4 compatible) in working directory.
Input: filename
Output: none
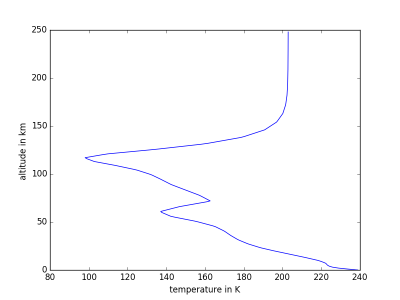
MCDinterface.Hprofile.heightPlot(param)
Simple function for plotting a parameter against altitude above surface.
Input: param
Indice of parameter to plot on x axis:
- 0: temperature in K
- 1: density in g/cm ^3
- 2: pressure in pa
- 3: dust mass fraction
- 4: CO2 mass fraction
- 5: N2 mass fraction
- 6: Ar mass fraction
- 7: CO mass fraction
- 8: O mass fraction
- 9: O2 mass fraction
- 10:O3 mass fraction
- 11:H mass fraction
- 12:H2 mass fraction
Output: none
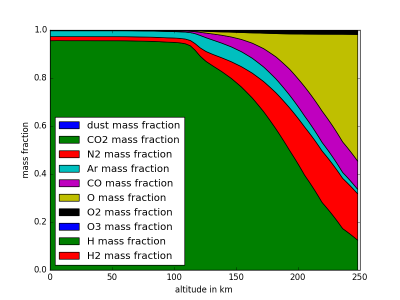
MCDinterface.Hprofile.fractionPlot(self,comp=“molecular”)
Plots mass fractions of atmpsheric components against altitude.
Input: comp
Wether to show molecular (if comp==“molecular”) or elementar (comp==“geant4”) components
Example Usage
import MCDinterface as mcd
#let's look at the atmospheric layers above equator
longitude =0.0
latitude =0.0
#select some time input in solar longitude
xdate=180
#select midday as local time
localtime =12
#create an instance of Hprofile, enable dust
H=mcd.Hprofile(longitude,latitude,xdate,localtime,dust=True)

#we have to actually get the data from the MCD
layers = H.retrieve()

#now plot the temperature against height
H.heightPlot(0)

#or plot the mass fractions of atmospheric components against height
H.fractionPlot(comp="molecular")
MCDinterface.Hprofile(lon,lat,alt,minDate,maxDate,localtime,tsteps=100,scenario=1)
| Constructor Input | ||
|---|---|---|
| lon | scalar | marsian longitude |
| lat | scalar | marsian latitude |
| minDate | scalar [0:360] | minimum date to compute (solar longitude) |
| maxDate | scalar [0:360] | maximum date to compute (solar longitude) |
| localtime | scalar [0:24] | marsian local time in hours |
| tsteps | scalar | number of steps between minDate and maxDate to compute |
| scenario | int | simulation scenario as specified in MCD user manual |
MCDinterface.Tprofile.retrieve()
This function calls the MCD in order to retrieve the data specified by the given class parameters.
One has to call this function on an instance of Tprofile once and after making changes to the instance.
Output:
t: array of shape (n,) with computed timepoints .
A: array of shape with(n,12) computed atmospheric parameters as specified bypsf format.
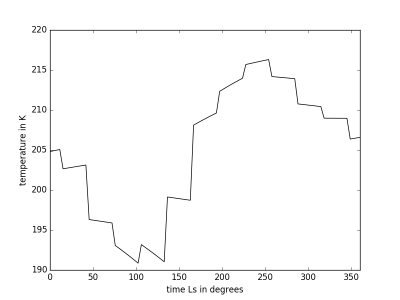
MCDinterface.Tprofile.timePlot(param)
Plot selected parameter indice t on y and time on x axis. Input indices same as Hprofile.heightPlot(param)
Example Usage
altitude=10000

T=Tprofile(longitude,latitude,altitude,0.0,360.0,0,tsteps=96)
t,A = T.retrieve()
T.timePlot(0)


