Table of Contents
1 Output file description
1.1 modes
AtRIS provides several modes of data output 1). The execution mode has to specified when starting the simulation, either using a single macro:
./AtRIS QGSP_BERT_HP simprefix MODE
or in the corresponding python batch script. Here mode can be:
- -1 (default): calculate ionization and absorbed dose rate.
- 0: in addition, provide binary data about all particles crossing atmospheric volume interfaces.
- 1-665: provide binary data about particles crossing a specific volume interface (the number indicates the DIID2)) [large data product].
- 666: detailed ascii data containing all processes throughout the atmosphere [very slow, huge data product].
Under typical scenarios, mode -1 will suffice. Mode 0 is particularly useful if one needs to investigate the secondary particles population across the whole atmosphere. The single interface modes (1-665) are useful when investigating a single interface (for example the surface with mode 1). The final mode makes the visualization of particle showers possible. We divide once more with 1000 to express the result in terms of $\rm{mSv}$, a quantity typically used in the community when discussing radioactivity.
1.2 format
For the most part, AtRIS relies on Geant4 Analysis features implemented in the G4CsvAnalysisManager for the output generation. Histograms are saved in form of ascii data containing coma separated values using a format in which a single line corresponds to a single histogram bin. The header contains extensive data about the binning, physical units, etc… For each bin, the following data is available:
- 1D histograms:
- 2D histograms: In addition to the above:
- Sxw1
- Sx2w1
These are in fact based on the libraries inlin/exlib 5) and are often used with the ROOT package (see 6)) and thus will not be described here in detail. If you are doing your data analysis with the scipy package, be careful when reading in this data! I will provide a couple of scripts which haven't been sufficiently tested.
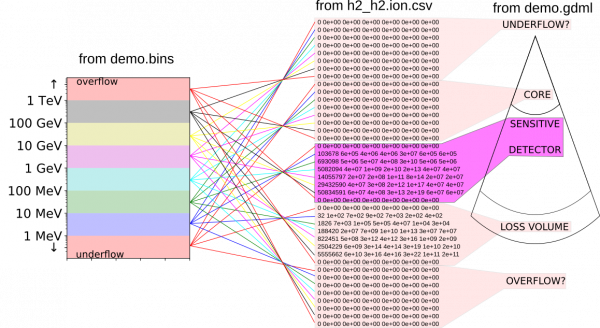
Here is a picture illustrating the h2_h2.ion.csv histogram, its structure and also what has to be removed to make it usable. The main source of complication are the various overflow and underflow bins which geant4 keeps internally. These are not useful in our case since we are keeping the relevant variables under direct control. This clean up is performed by AtRIS when saving its custom ionization density and dose rate formats (see below). All files belonging to the “demo example” can be found under examples.
2 custom output
When the simulation is done, AtRIS generates two additional files:
- SIMPREFIX.ioni, and
- SIMPREFIX.dose,
which are restructured and normalized versions of the SIMPREFIX_h2_h2.ion.csv and SIMPREFIX_h2_h2.dos.csv. The following normalizations have been applied:
- ion.csv:
- Each point has been divided by the volume of the corresponding sheet expressed in cm^3, in order to convert from eV/sheet to eV/cm^3. This ionization density is due to the effect of all the particles generated within that particular column (energy bin).
- Each point has been divided by the number of particles in the corresponding column (the entries column of the _h1_h1.1 histrogram), in order to convert from total ionization energy density to the average ionization density expressed in eV per cm^3 per particle.
- The final result is a matrix containing the ionization density in eV/cm^3, whereby the rows correspond to atmospheric sheets and columns correspond to energy bins used for the simulation
- dos.csv:
- Each point has been multiplied by the corresponding area factor relating the cross section of the ICRU water phantom $A=(15\rm{cm}^2\pi)$ to the are of the detector interface. After this procedure, each point specifies how much would have been deposited in an ICRU water phantom at that particular location (altitude) through ALL particles of that particular energy (column).
- Each point has been divided by the number of particles in the corresponding column (the entries column of the _h1_h1.1 histrogram), in order to convert the energy deposition of ALL particles to an average energy deposition.
- The average energy deposition in eV is converted to Joules (multiply with $1,60218\cdot 10^{-19}\frac{\rm{J}}{\rm{eV}}$) and divided by the mass of the ICRU water phantom ($m=\rho\cdot V=1\frac{\rm{g}}{\rm{cm}^3}\frac{4}{3}\pi(15\rm{cm})^3=14.137167\rm{kg}$). The result is the average absorbed dose in an ICRU sphere water phantom expressed in Sievert.
- General notes:
- The core, loss volume rows, as well as the underflow and overflow bins are disregarded.
- Also all information related to the statistical properties of the bin entries are disregarded. The courius reader has to consider the geant4 csv output if these quantities are needed.
- AtRIS has been designed to quantify average effects of primary particles. Each bin entry describes what a particle of that particular energy (column) does in that particular atmospheric sheet (row) on average. Thus these custom file formats make no sense when a simulation is performed with an actual differential flux. For this, the advanced user has to use the geant4 csv output to obtain the wanted information.
